Reports
Reports function like Views to organize your data for display and analysis, and provide a visual representation of your data, customized to present Performance Indicators as a Dashboard view of your business.
Unlike Views, where data is restricted to a single object, Reports can present data from any Object or from multiple objects (Database Views).
About Reports
The platform's reporting engine provides a full set of options for users to dissect and refine into the format needed to make strategic business decisions or to monitor key performance indicators. Data can be filtered, ordered, color-coded, grouped, or charted into insightful management reports.
Each application in the platform includes a group of standard reports. You can modify an existing report, or build new custom reports on an ad hoc basis. In addition, these presentation features are included:
- Build a tabular or matrixed report and optionally group information by rows and columns
- Provide basic computation functions with optional row/column count
- Color coding
- Chart data in a variety of graphic styles
- Schedule Reports for automatic delivery
- Email reports to team members
- Join and present data from multiple objects to form ad-hoc reports (Database Views)
- Display reports on the Home Page as a Widget (chart-based widgets are especially powerful)
- Export the report to PDF or to CVS file
- Build ad hoc fields that support complex data modeling and analysis with Computed Fields and Summary Computed Fields
- In Reports based on Tasks and Appointments, the Calendar Category is available as a field
Charts
Available chart formats for Reports:
Pie Chart
Funnel Chart
Vertical Bar Chart
Horizontal Bar Chart
Line Graph
Meter Gauge
Vertical Stacked Bar Chart
Horizontal Stacked Bar Chart
Vertical Grouped Bar Chart
Horizontal Grouped Bar Chart


Tabular Report
Tabular reports display data in rows and columns, as a table, with optional Color Coding to highlight significant rows.
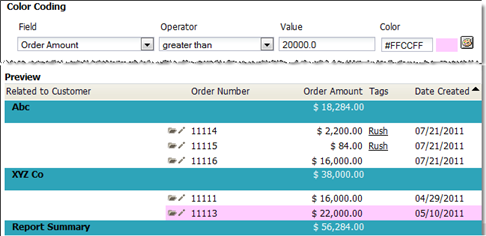 Table of Orders by Customer

Matrix Report
Matrix reports are used to organize and summarize your data, and are exceptionally well-suited for chart and dashboard views.
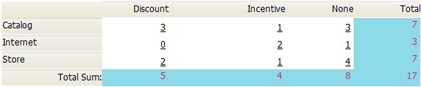 Orders by Source (Internet, Store, or Catalog) and by Offer (Discount, Purchase Incentive, or None).

The Matrix Report has a familiar format that you may know as a cross tabulation report (cross tab) or a pivot table. The resulting data is organized into a two dimensional grid which summarizes data (by total $, row count, or %).
The Matrix Report shows only summary information, based on the selected Row and Column Groups.
To create a Matrix Report, add one or more Row Groups and one or more Column Groups.
Chart Formats
Available chart formats for Reports:
Pie Chart
Funnel Chart
Vertical Bar Chart
Horizontal Bar Chart
Line Graph
Meter Gauge
Vertical Stacked Bar Chart
Horizontal Stacked Bar Chart
Vertical Grouped Bar Chart
Horizontal Grouped Bar Chart
Reports in PDF Format
To print large reports in PDF format, you should Schedule a Report.
A Single Record can be printed as a PDF file as well.
- Learn more: Print a Record
Manage Reports
This section describes how to run, modify and create new reports. From the Reports tab, these buttons are available:
About Report Folders
Reports in Folders can be designated as visible to specific teams, roles, or users. See Report Folders for more information.
If a User has the viewing rights to a specific report, but does not have rights to view all the data, the report will only present the data that the user has permission to access.
Run a Report
To run a report:
- Click the Reports tab to display the list of available reports
- A series of options are available for each report
- Send a report via email, as an HTML file attachment to selected Users or Contacts. Find additional details at: Email a Report
- Edit
- Modify the report and Save it, or Save As a new report
- Delete
- Delete the report
- Report Name
- Run the Report
- Click the Report Name to run the report
Options in Reports
When users click the [Run] button to Run a Report, a series of options become available:
- Customize
- Edit report options
- Save
- Save the report
- Save As
- Save the current report with a new name
- Excel Print
- Save the report as an Excel .xls file
- HTML Print
- Display the report in a browser window; it can then be printed or saved from the browser controls
- Export
- Save the report as a .csv file
- Cancel
- Cancel the action
Add or Edit a Report
To add or edit a report:
- From any application, click the Reports tab and choose one of the following options:
- Add a new report, click the [New Report] button
- In the Category tab, select the desired Report Category
- See Database View for more advanced report category options
- When the selected category is Tasks and Appointments, the Calendar Category is available as a field
- In the Category tab, select the desired Report Category
- Navigate to an existing report and click the Edit link
- Click the Fields tab and select the fields to include in the report.
- Optionally, click the Order tab to select the order of the columns in a tabular report, or to define the sort order for records in the report
- Optionally, click the Filter tab and select the filtering options to apply
- Optionally, click the Quick Filter tab to select fields for adhoc filters
- Optionally, click the Color Code tab to create conditional color-coding of report rows
- Optionally, click the Group tab to create Tabular or Matrix reports
- Optionally, click the Compute tab to add metrics to the report
- If Grouping options were selected, click the Chart tab to select charting options
- Click the [Preview] button to view how the report will appear, or click the [Run] button to generate the report
- Click [Save]
- Select the Visibility option to apply - this defines who can see the new report.
Repeat the process to create new reports from existing reports, building on the established data.
Move a Report
Moving reports involves not only modifying what data is included or excluded from the report, but may involve changing folder properties to include Visibility rights to those reports.
- For example: If you have granted visibility rights to Everyone to view a certain report, you cannot move that report into a folder that restricts rights to a certain Team.
To move a report:
- From any application, click the Reports tab
- Click the Edit link next to the report you want to edit
- Optionally, change the type of information that is generated by this report by modifying the Fields, Filter, Group, Compute, or Chart options
- Finish:
- Click [Save] to save the existing report
- Click [Save As] to save the changes as a new report, with a new name
- Select a Folder
- If you save an existing report in a new folder, that report is moved to the new folder
- Click [Save]
Delete a Report
Editing or moving reports involves not only modifying what data is included or excluded from the report, but may involve changing folder properties to include Visibility rights to those reports.
- For example: If you have given visibility rights to everyone to view a certain report, you cannot move that report into a folder that restricts rights to a certain team.
To Delete a Report:
- From any application, click the Reports tab
- Click the Delete link next to the report you want to remove
- Click OK in the confirmation. The report is removed from the Reports page.
Email a Report
Reports can be emailed to other team members or any other recipient.
Reports can be attached to email messages in any of these file formats:
- HTML
- CSV

Users that have the Export Views and Reports permission can Email a Report
To Email a Report:
- From any application, click the Reports tab
- Click the Email link next to the report you want to send. If the report is not visible, make sure the folder containing that report is selected in the Folders drop-down list.
- In the Send Report By Email page, complete the information under Receiver Details
- To
- Enter the name of one or more email recipients, or click the Lookup button to select team members
- Subject
- The report title appears by default, and can be edited
- Message
- The text that will appear in the body of the email message
- In the Choose Reports to be delivered section, complete the following information:
- Reports:The selected report is included by default
- Optionally, select additional reports to be attached to the email message
- Print Format
- HTML is the default format
- Choose from: HTML, CSV or PDF
- Optionally, click the checkbox to Print in Landscape format
- Click the [Send] button to send the email message
Schedule a Report
-
Users that have the Export Views and Reports permission can Schedule a Report
If you have reports that you run on a regular basis you can have the platform do the work for you and automatically email the reports to specified users.
- Considerations
- The Schedule Title is used as the email subject
- Scheduled reports are submitted for processing at the time you request. However, processing and delivery of the reports depend on the current system load, so response time may vary. Please schedule reports well in advance of your need.
- Multiple reports can be selected for scheduling
- Reports can be sent to groups of Users, Teams or users based on their Role
To Schedule a Report:
- Click the Reports tab
- Click the [Scheduled Reports] button
- A list of scheduled reports is displayed
- Click the [Schedule Report] button
- In the Schedule Information section, complete the following information:
- Schedule Title
- The name for this scheduled report
- Select Reports to Run
- Click the Lookup
 icon to select the reports to run
 - Optionally, click the Remove
 button to delete a report from the schedule
 - Print Format
- Choose one of the following formats:
- PDF (the default setting)
- HTML
- CSV file
- HTML with link
- Styled like the HTML report, this print format includes clickable links to records in the platform. Note: Quick Edit
 icon for contacts, leads and account columns are not shown.
- Styled like the HTML report, this print format includes clickable links to records in the platform. Note: Quick Edit
- In the Select Users section, click the Lookup icon to select the email addresses of the recipients
- If a Team is selected, an Include Subteams checkbox option appears
- Unchecked by default
- When checked, includes Subteams (Child Teams)
- Duplicate email addresses are automatically omitted
- In the Copy All Reports To section, specify email addresses of additional recipients, separated by a comma
- In the 'Schedule Reports section, complete the following information:
- Run Date
- Enter a date or click the Calendar button to select a date on which to run the report(s)
- Recurrence
- How often you want to run these reports; The default option is Does Not Recur
- Run Time
- Select the hour and minutes when to start running the report(s)
- Stop Date
- Select Until and select an ending date to run the reports at the designated time and recurrence interval, or accept the default No End Date to run the report(s) at the selected time and recurrence interval endlessly
- Click [Save]; The Reports page displays a confirmation message and details about the scheduled report(s)
To change any of the batch reporting information, select a report from the list of scheduled reports, edit and save.
Change or Delete a Report Schedule
To change or delete a report schedule:
- Click the Reports tab
- Click the Scheduled Reports button
- Click on the schedule Title to open the Schedule Reports detail page
- Change any of the information that is included and click the [Save] button to save your changes
- Optionally, click the [Delete] button to remove the scheduled report
- There is no confirmation to reverse this action
About [Save] and [Save As]
- The [Save] and [Save As] actions allow reports to be saved to these folders:
- My Report
- Unfiled Public Report
- Folder(s) created by the User
- Folder(s) the User can access, as determined by Folder Visibility settings
- [Save] replaces the original report
- [Save As] makes a copy of the report to the selected folder
About Views, Reports and Object Inheritance
About Views, Reports and Object Inheritance [[Category:Template:Features]]