Exercise 09: Managing Data
From AgileApps Support Wiki
Introduction
Data Display Options
- Views and Reports organize data to be displayed
- Views and Reports can be also displayed as Widgets on a Dashboard
Views
- Find “records of interest” and present them on screen
- Present data of one Object in a list format
- Typically used to navigate to particular records
- Default Views and custom Views
Reports
- Provide high-level perspective operations
- List records, make graphs, calculate summaries (max, min, sum, avg)
- Add formula fields
- Example: (numberField=1) if checkbox_flag=true, else (numberField=0)
- Can then total the number of checkboxes and get sum or average
- Can also be used to drill down to a particular record (like a View)
- Can display joined data of related Objects using Database Views
Custom Views
- You can edit/configure default Views for an Object
- You can also add custom Views for an Object
- Specify:
- Fields to be displayed
- Field column order
- Optional filter(s) by date or field value
- Provide a View name when saving
- Determine visibility
Report Features - Overview
- Organize Reports into report folders
- Group data by rows and columns
- Computation functions
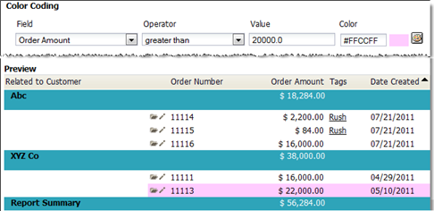
- Color Coding
- Chart data in many graphic styles
- Email Reports to individuals or teams
- Display Reports as a widget on the Dashboard
- Export Reports to PDF or CSV file
- Excel Print (.xlsx)
- HTML Print (browser window, use “Save As” to store)
- Create ad hoc Computed Fields (in each record) and Summary Computed Fields (to summarize a column of data)
- Report Schedules: run one or more Reports at a specific time
- Join & present data of multiple Objects via Database Views
Structures that can be Used in Reports
- Chart formats:
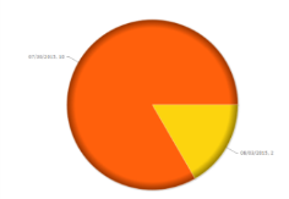
- Pie
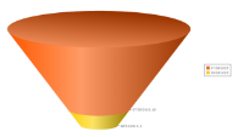
- Funnel
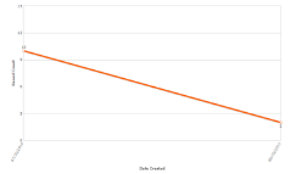
- Line
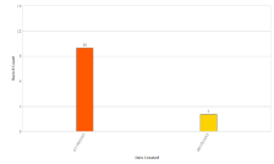
- Bar Chart
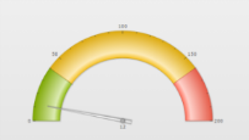
- Meter Gauge
- Pie
- Tabular Reports display data in rows and columns with color coding
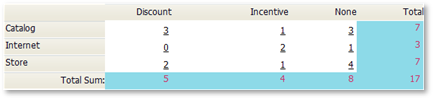
- Matrix Reports summarize data
- Chart formats:


Reports and Database Views
Joining Data of Related Objects
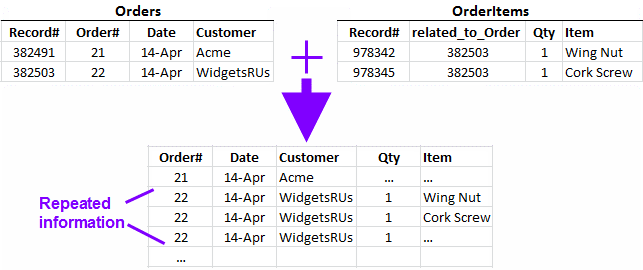
- A database join combines two or more tables to create a new, virtual table
- In the AgileApps platform, that goal is achieved using a Database View
- A Database View lets you define a complex data model by specifying a join across related Objects
- A Database View lets you define a complex data model by specifying a join across related Objects
- A Database View can be used as the basis for a Report

Organizing and Scheduling Reports
- Reports can be organized into Report Folders
- Permissions can be set up for a specific Report
- You can additionally define Report Schedules to schedule Reports to run
- Report will be sent by mail
- Specify:
- Print Format
- Recipients email addresses
- Scheduling details
- Run Date
- Recurrence
- Run Time
- Stop Data
- Reports can be organized into Report Folders

Dashboards
- Application comes with an “Application Home Page” Dashboard
- You can
- Create new Dashboards with one up to three columns
- Add/remove/customize Widgets to/from/on existing Dashboards
- Widget displays
- View
- Report
- HTML
- Page
Managing Views, Reports, and Dashboards
- Regular users can create Views, Reports, and assemble Dashboards
- Administrators
- Have global access to all Views (record lists) and Reports defined across the Tenant
- Can fix a View or Report created by any User
- Modify or remove a View or Report created by someone who is no longer with the organization
- Configuration > Administration > Access Management > Manage Views and Reports

Further Administration Options
- Data Management
- Manage large amounts of data in one step
- Merging Case data for one Case record
- Account Management
- Manage your company’s account
- Monitoring
- Monitor operations that are running in the background
- Data Management
Administration - Data Management Categories

Importing Data: Records with Lookup Fields
- Upload the lookup target records (for example, Accounts)
- Upload records with lookup fields (for example, Cases)
- For each lookup field:
- Select the data column that has a lookup value to use
- The select a “foreign key” field to “Match by”

- With those settings, the account name stored in the CSV file is compared to the Account Name field in the Accounts records
- The first matching record becomes the target of the Lookup field
- Can also match using:
- The record ID field (for exported data that contains it)
- The “record identifier” defined for the target Object
- With those settings, the account name stored in the CSV file is compared to the Account Name field in the Accounts records
Merging Data
- While viewing a Case, in the Actions list, a user can:
- Select Merge
- Operation exists only for the Cases Object
- Choose a target record to merge with
- Result:
- The current record is moved to the recycle bin
- The target record appears in the user’s display, with its fields unchanged
- Summary and description from the original record are added to the target-record’s activity history
- The original record’s activity history and files are added
- Tasks from the original case are added to the target record (The target record’s owner becomes the owner of the tasks)
- Processes from the original case are transferred to the target record
Exercise
This exercise has four parts:
- In Part 1, you create a custom View that shows only Priority 2 orders.
- In Part 2, you generate a Report that includes a pie chart.
- In part 3, you create a Dashboard.
- In Part 4, you export data from an Object to an Excel spreadsheet.