Part 2: Generate a Report using a Pie Chart
From AgileApps Support Wiki
In this part of the exercise, you generate a report that includes a pie chart.
- Click the Reports tab, and then click + Add new report.
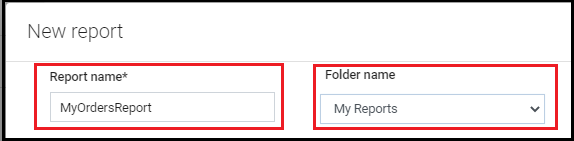
- Provide MyOrdersReport as Report name and select My Reports as the target folder from the Folder name drop-down.
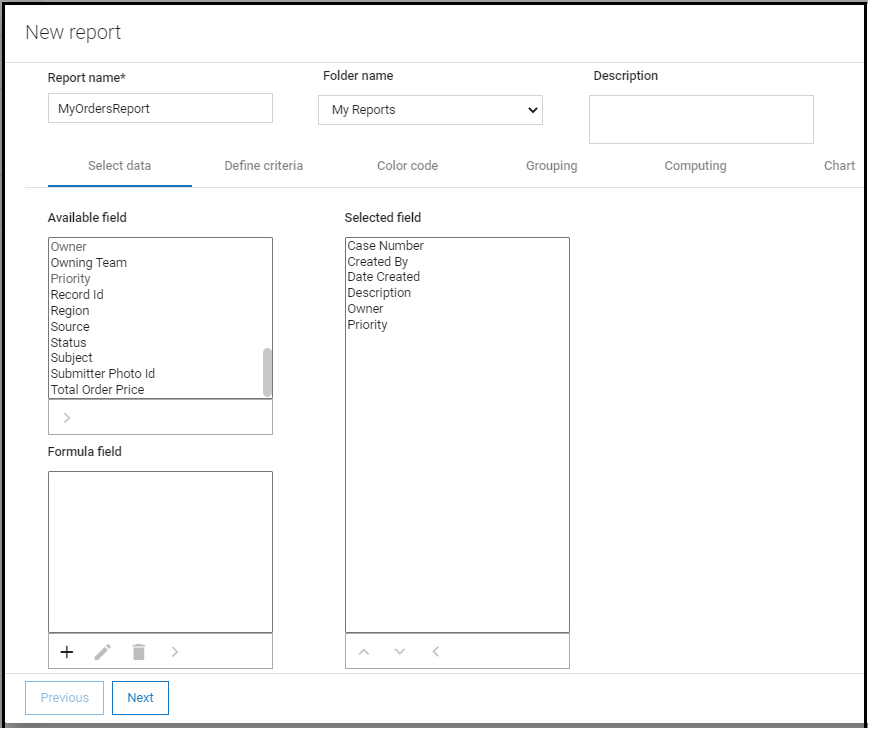
- In the Select data tab, for Report category field select Orders.
- From the Available fields box select the following fields to include in the Selected field (press <Ctrll> for multi-select) and click >. The following fields get displayed in the Report:
- Case Number
- Created By
- Date Created
- Description
- Owner
- Priority
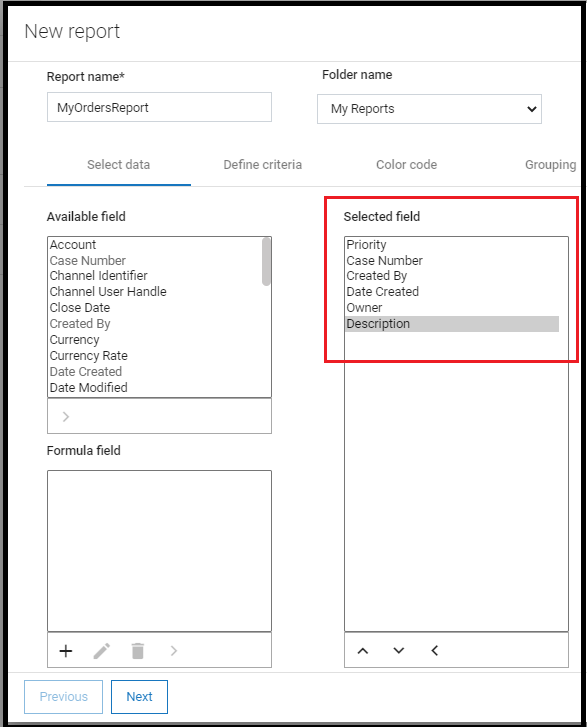
- Change the sequence of the fields by using the Up and Down arrows in the selected fields to match the following screenshot.
- Under the Sort by tab, select Priority in the Primary sort by field. Keep the option Ascending selected as it is. Click Next.
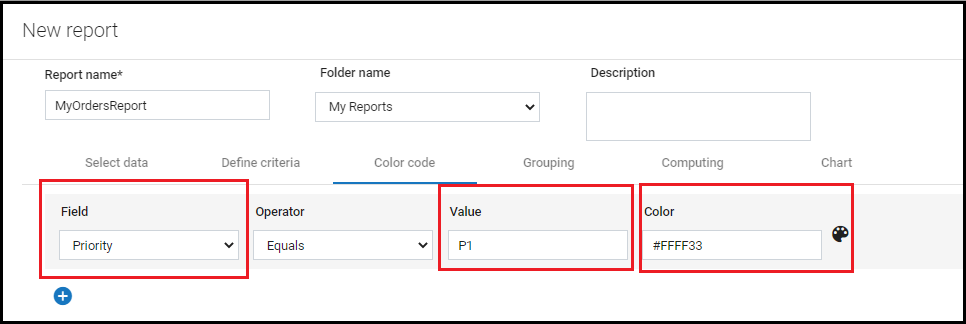
- Under the Color code tab, select Priority in the Field drop-down, enter P1 in the Value text box, and enter #FFFF33 in the Color field for the records to be displayed in the Yellow color.
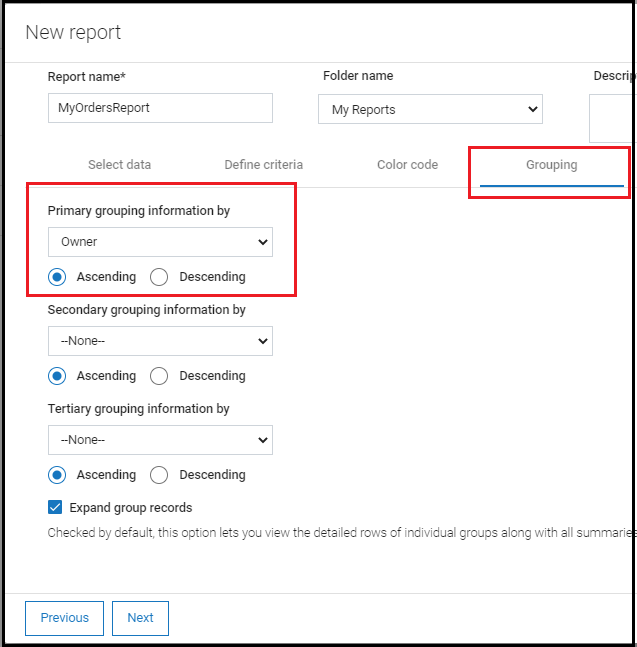
- Under the Group tab, specify Primary grouping the information by as Owner and sorted in Ascending sequence. Click Next.
- Under the Computing tab > Compute section, keep the default things as they are, and click Next.
- Under the Chart tab. Select Pie for Type. Leave all other values unchanged.
- Click Save.
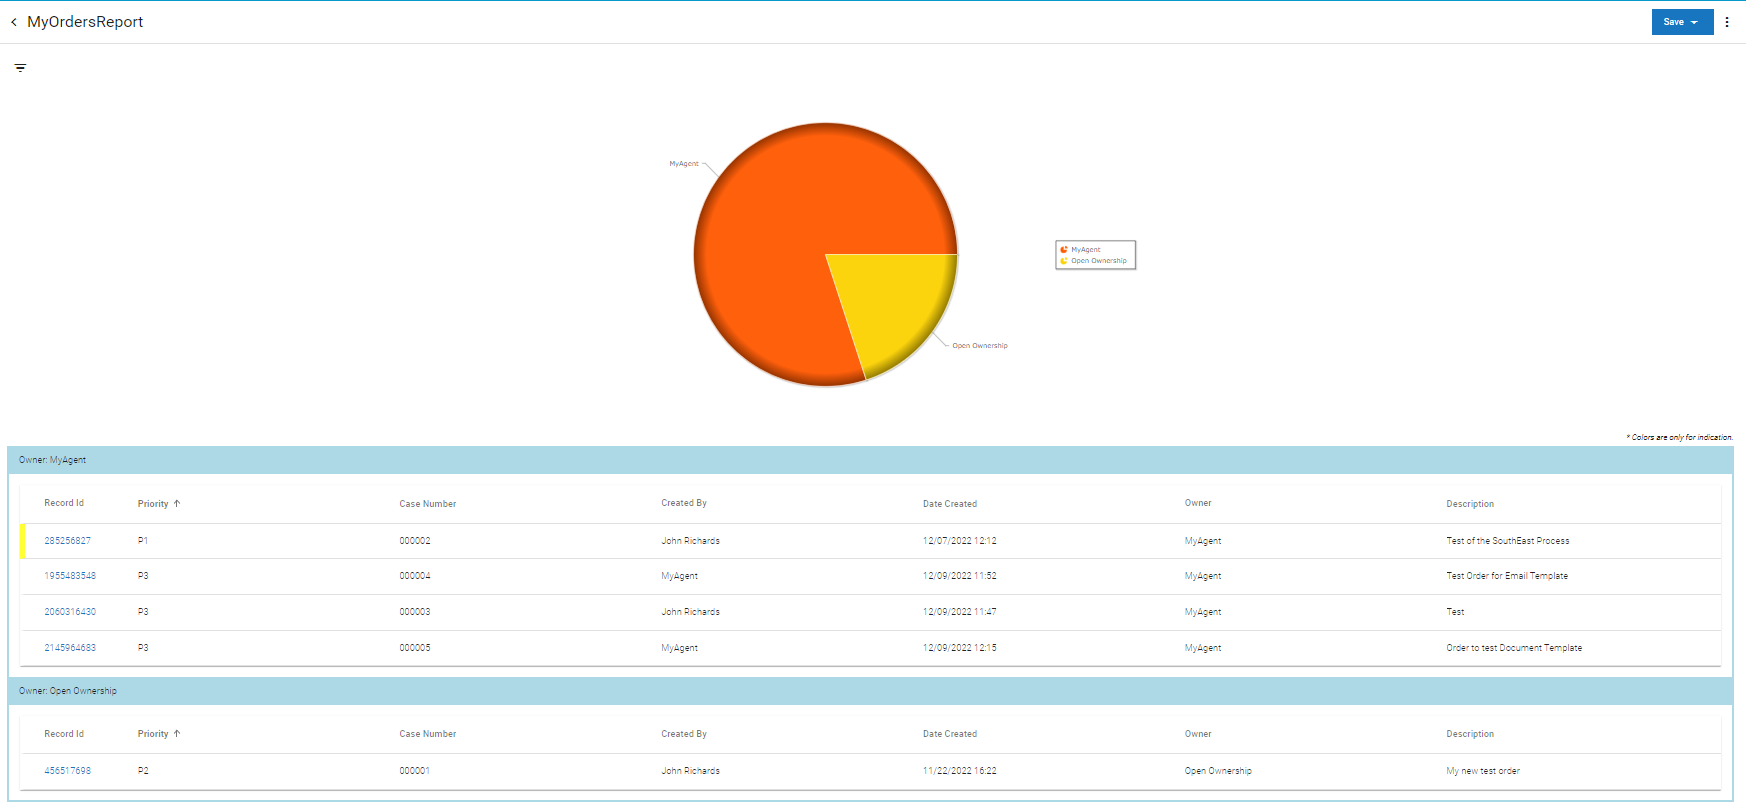
- The MyOrdersReport report is displayed as shown in the following figure: