Difference between revisions of "Part 3: Create a Dashboard"
From AgileApps Support Wiki
Wikieditor (talk | contribs) (Created page with "In this part of the exercise, you create a dashboard that includes the View and the Report you created in Parts 1 and 2. # Click the '''Dashboard''' tab. # Click the '''New Da...") |
Wikieditor (talk | contribs) |
||
| (One intermediate revision by the same user not shown) | |||
| Line 1: | Line 1: | ||
In this part of the exercise, you create a dashboard that includes the View and the Report you created in Parts 1 and 2. | In this part of the exercise, you create a dashboard that includes the View and the Report you created in Parts 1 and 2. | ||
# Click the '''Dashboard''' tab. | # Click the '''Dashboard''' tab. | ||
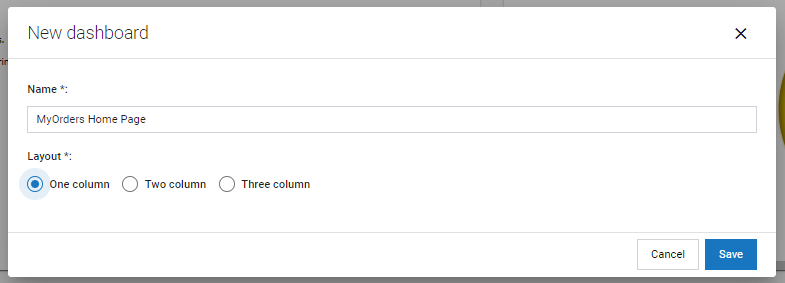
# Click the '''New Dashboard''' link present on the right side of the '''Dashboard''' page and enter the values as shown: | # Click the '''New Dashboard''' link present on the right side of the '''Dashboard''' page and enter the values as shown:<br><br>[[File:New_Dashboard.PNG|800px]]<br><br> | ||
# Click '''Save'''. | # Click '''Save'''. | ||
# Select '''MyOrders Home Page''' tab and click the '''Make as default view''' button to make it your default dashboard. | # Select '''MyOrders Home Page''' tab and click the '''Make as default view''' button to make it your default dashboard.<br><br>[[File:MyOrders_Home_Page_Make_Default_View.PNG|1000px]]<br><br> | ||
# In the '''MyOrders Home Page''', add the '''View''' that you created: | # In the '''MyOrders Home Page''', add the '''View''' that you created: | ||
## Click '''Add Widget''' and enter the values as shown: | ## Click '''Add Widget''' and enter the values as shown:<br><br>[[File:Add_Widget_-_MyOrders_Home_Page.PNG|900px]]<br><br> | ||
## Click '''Save'''. | ## Click '''Save'''. | ||
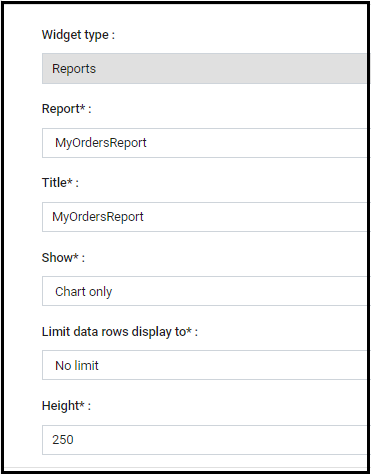
# Click '''Add Widget''' again. Add the '''MyOrdersReport''' report that you created. | # Click '''Add Widget''' again. Add the '''MyOrdersReport''' report that you created.<br><br>[[File:Add_Widget_-_MyOrders_ Report.PNG|500px]]<br><br> | ||
# Click Save. | # Click '''Save'''. | ||
# Optionally, add other widgets to your dashboard. | # Optionally, add other widgets to your dashboard. | ||
------------------------------------------------------------------------------------------------------------------------------------------------------------------------------------------------------------------------------------------------------------------------ | |||
:{| border="0" align="left" cellpadding="5" cellspacing="1" | |||
| | |||
[[Part 2: Generate a Report using a Pie Chart|Previous]] | |||
|} | |||
:{| border="0" align="right" cellpadding="5" cellspacing="1" | |||
| | |||
[[Part 4: Export Data|Next]] | |||
|} | |||
Latest revision as of 11:14, 14 December 2022
In this part of the exercise, you create a dashboard that includes the View and the Report you created in Parts 1 and 2.
- Click the Dashboard tab.
- Click the New Dashboard link present on the right side of the Dashboard page and enter the values as shown:
- Click Save.
- Select MyOrders Home Page tab and click the Make as default view button to make it your default dashboard.
- In the MyOrders Home Page, add the View that you created:
- Click Add Widget again. Add the MyOrdersReport report that you created.
- Click Save.
- Optionally, add other widgets to your dashboard.


