Difference between revisions of "Report Group"
imported>Evelyn m |
imported>Aeric |
||
| Line 1: | Line 1: | ||
Select fields to arrange and summarize data by Row or Column (Row Group and Column Group). | |||
:[[Image:Reportgroup.gif]] | |||
==Tabular Report== | ==Tabular Report== | ||
Revision as of 00:35, 30 May 2013
Select fields to arrange and summarize data by Row or Column (Row Group and Column Group).

Tabular Report
Tabular reports display data in rows and columns, as a table, with optional Color Coding to highlight significant rows.
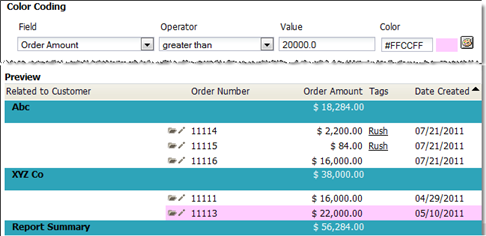 Table of Orders by Customer

Matrix Report
Matrix reports are used to organize and summarize your data, and are exceptionally well-suited for chart and dashboard views.
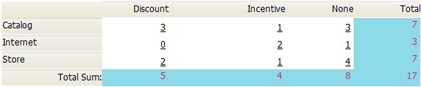 Orders by Source (Internet, Store, or Catalog) and by Offer (Discount, Purchase Incentive, or None).

The Matrix Report has a familiar format that you may know as a cross tabulation report (cross tab) or a pivot table. The resulting data is organized into a two dimensional grid which summarizes data (by total $, row count, or %).
The Matrix Report shows only summary information, based on the selected Row and Column Groups.
To create a Matrix Report, add one or more Row Groups and one or more Column Groups.