Case Analytics
Case Analytics is a special feature of the ServiceDesk application. This article explains the Case Analytics Dashboard and shows how the stored data can be used for reporting.
Case Analytics Dashboard
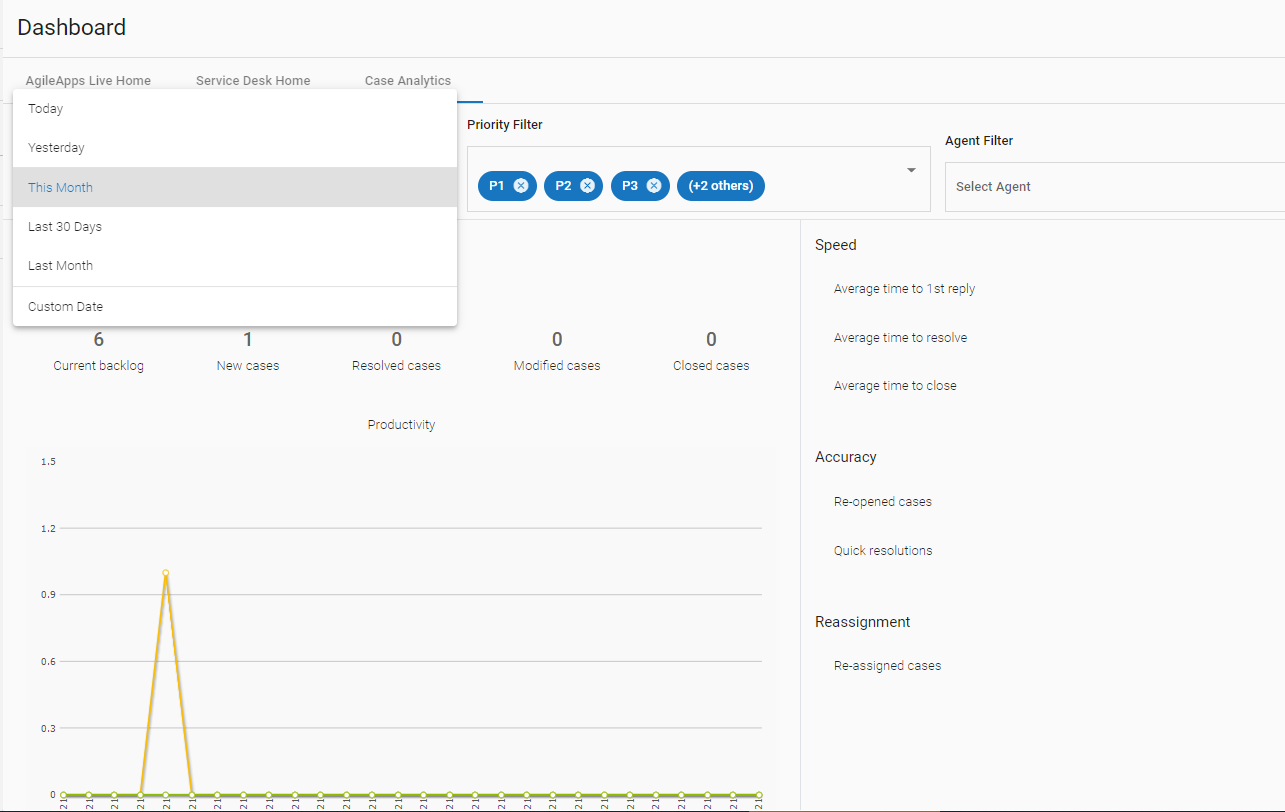
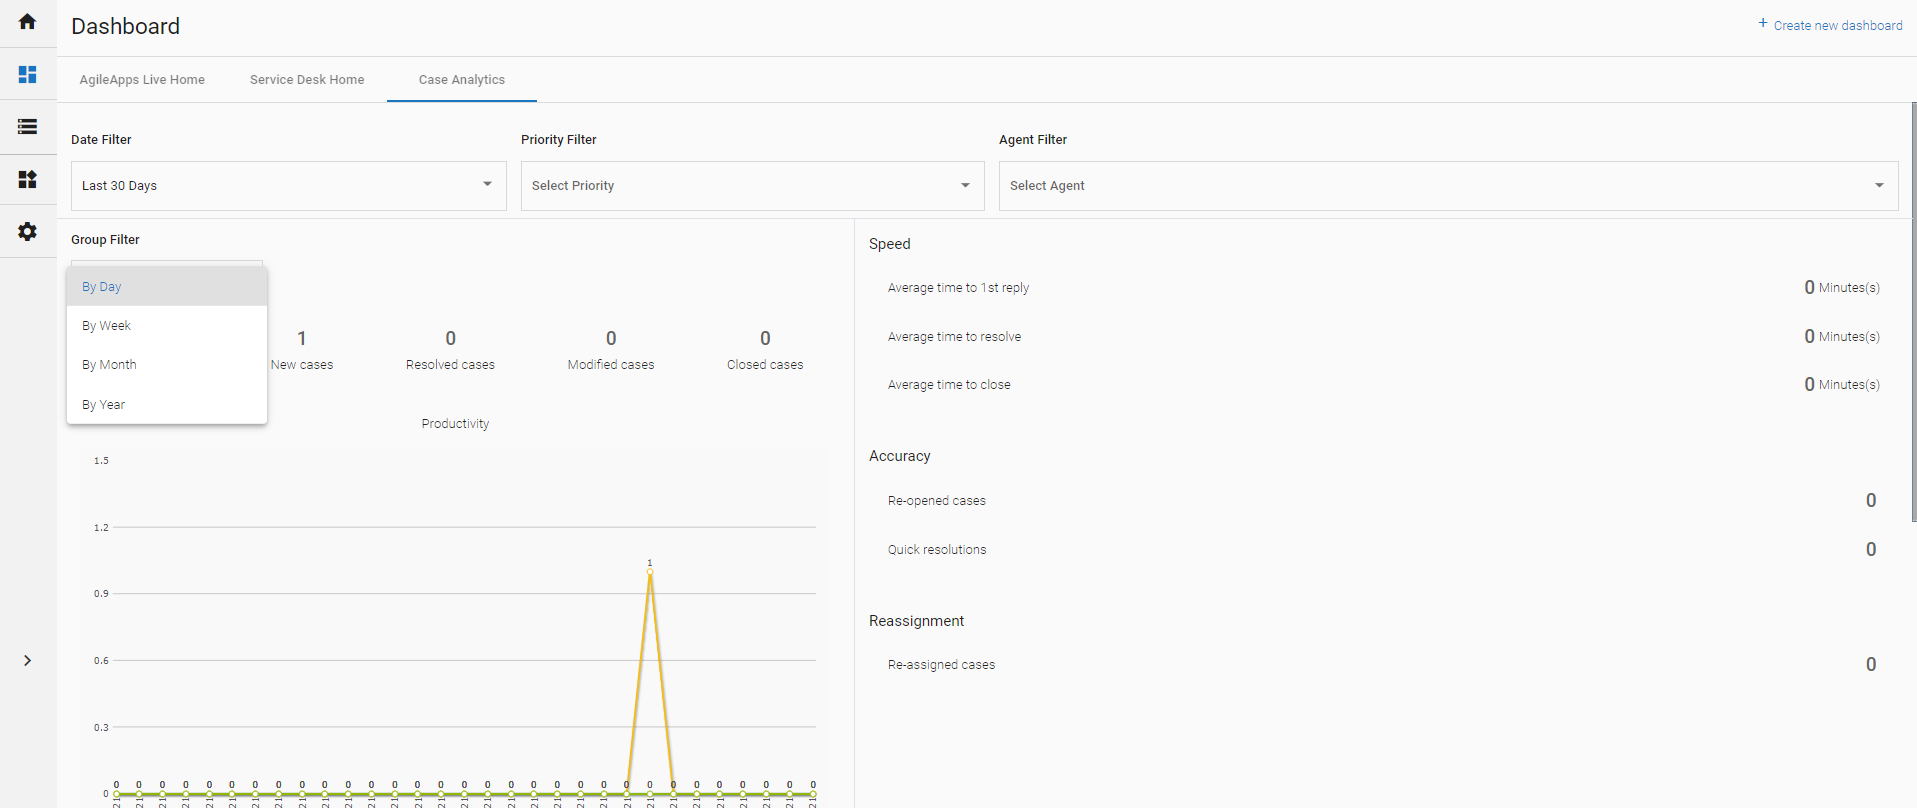
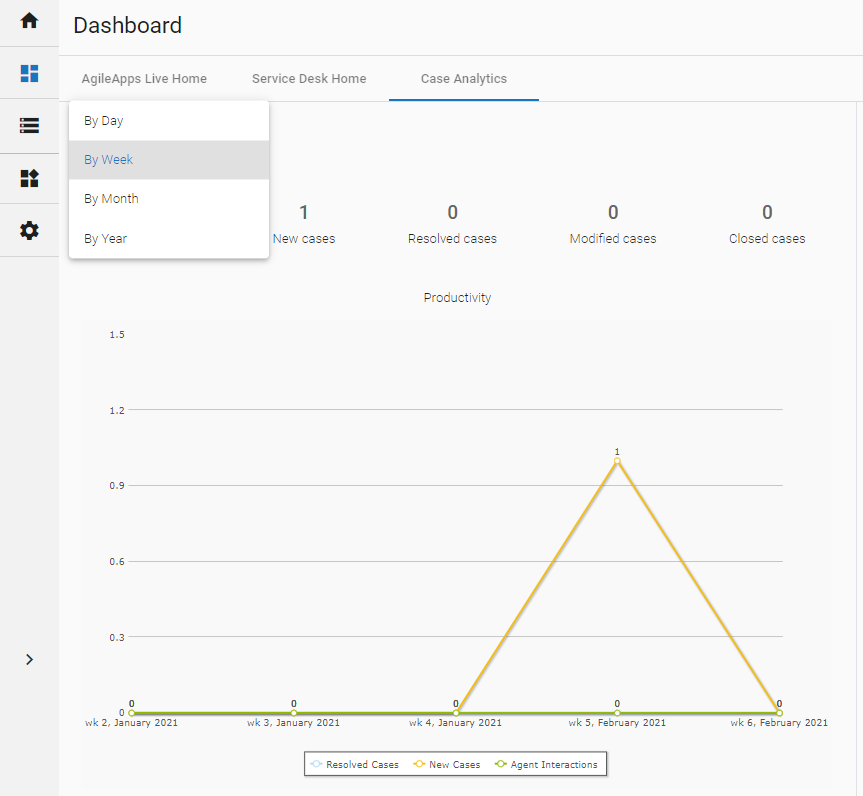
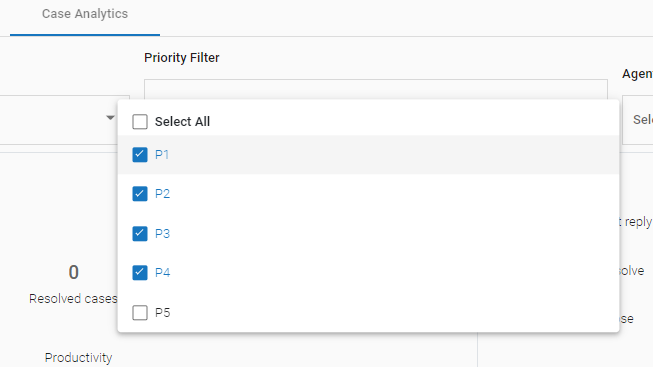
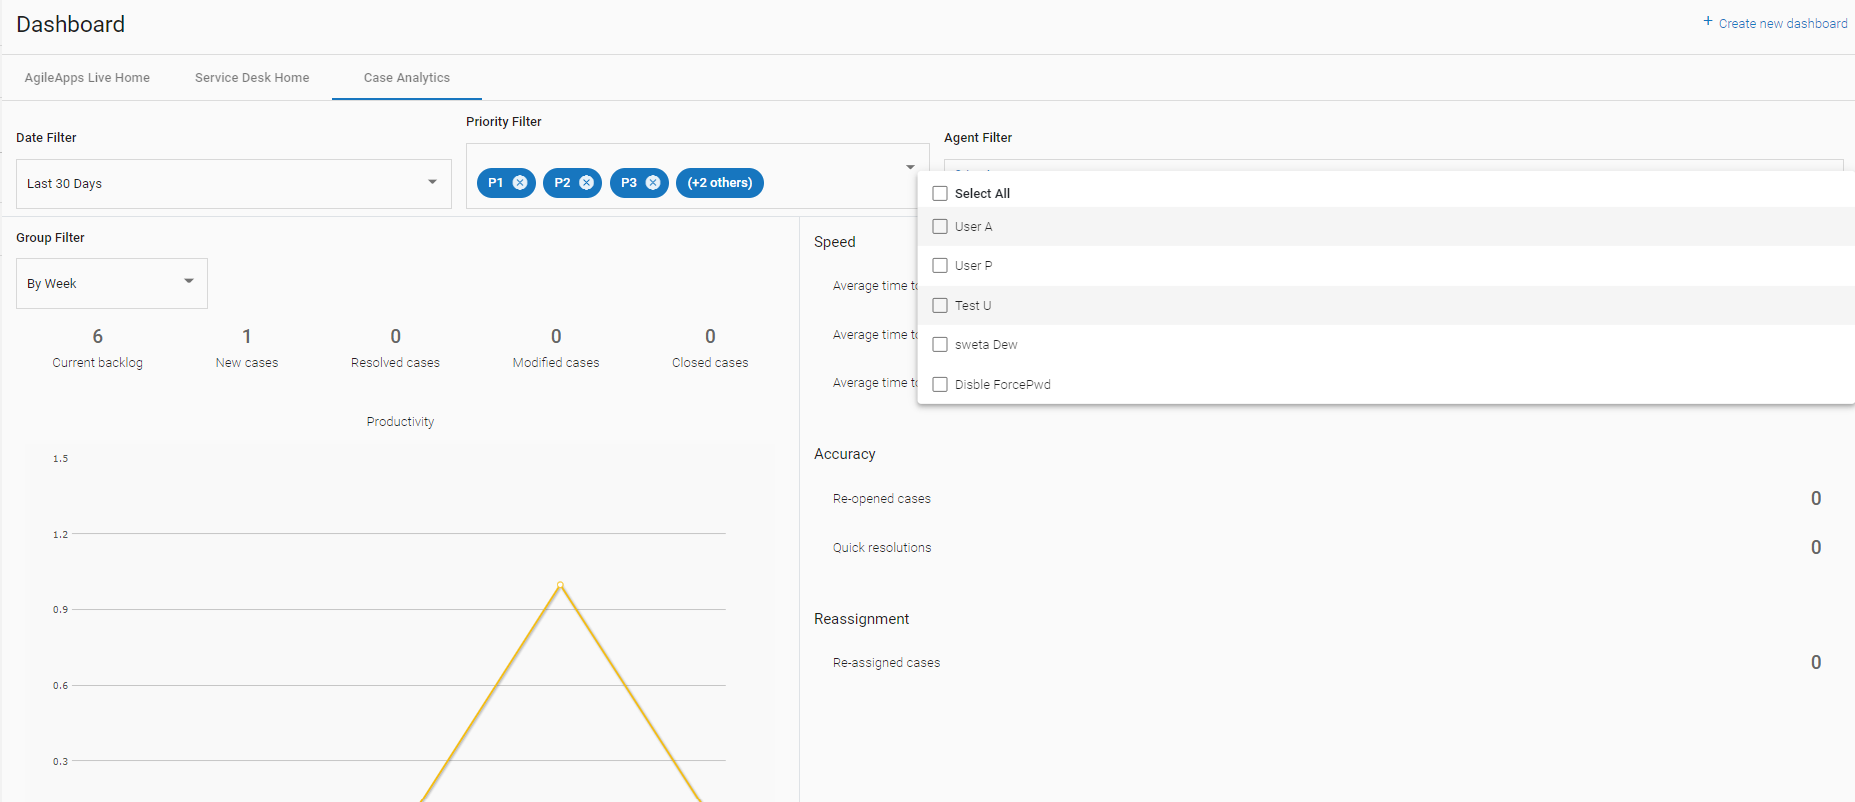
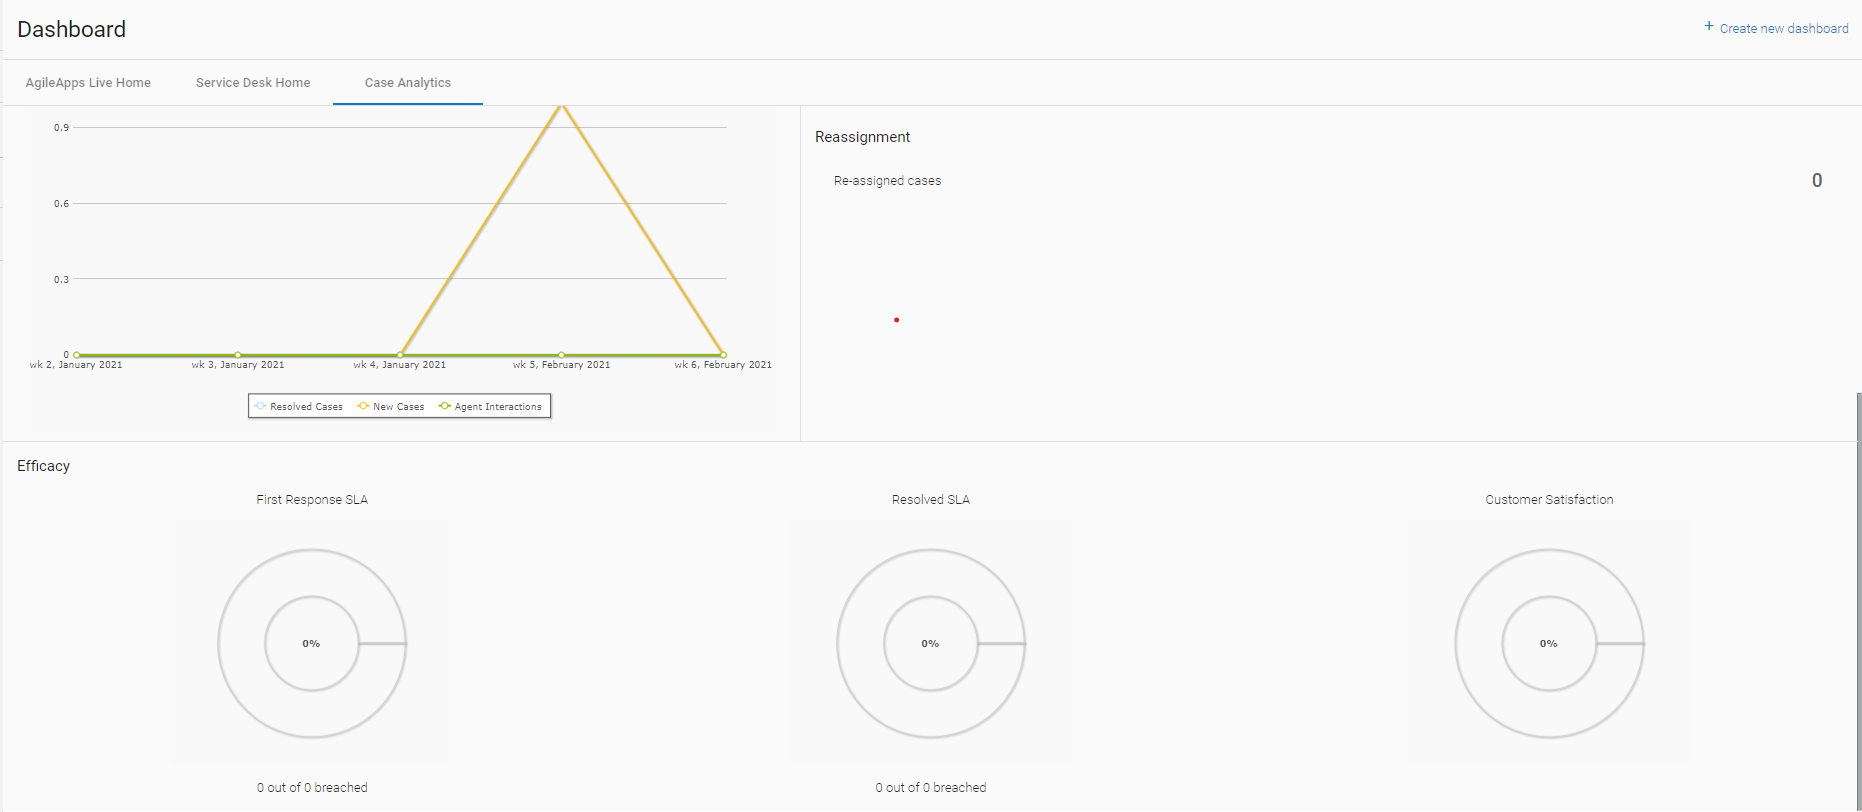
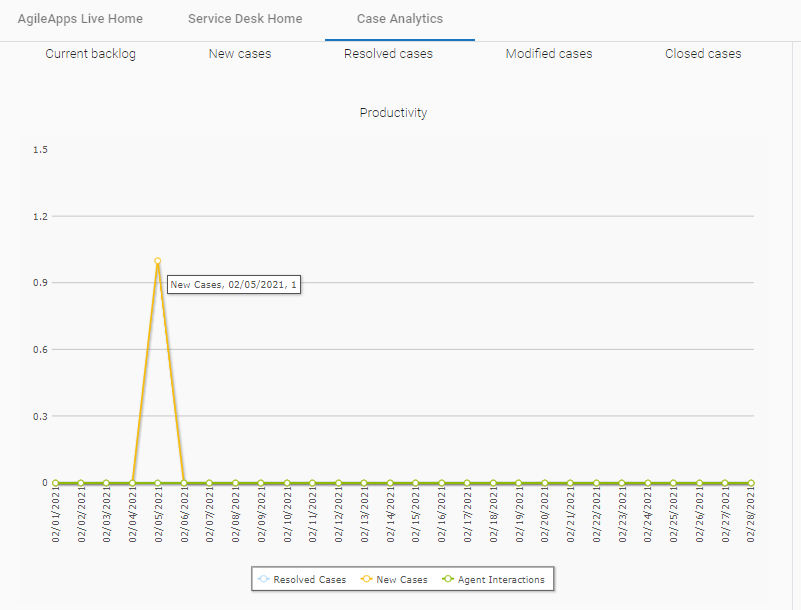
The images below show the initial dashboard displayed in the ServiceDesk application. In the table, aggregate number of cases is shown as per the filter selections in Date Filter, Priority Filter, Agent Filter, and Group Filter. Following choices are available in these filters:
- Date Filter:
- Today
- Yesterday
- This Month
- Last 30 days
- Last month
- Custom Date
- Priority filter:
- P1
- P2
- P3
- P4
- P5
- Agent Filter: Agents Configured.
- Group Filter:
- By Day
- By Week
- By Month
- By Year
To modify the display:
- Click the drop down list of the above mentioned options.
- Choose the agent, priority, date range to display, and group filter.
The graph changes to show the selected data.
Case Analytics Data
The Case Analytics dashboard displays statistical summary data. That data can also be used as the basis for a report, by selecting Case Analytics as the report category. (The data recording strategy keeps data storage to a minimum, and speeds up reporting.)
When creating such reports, it's helpful to know how the data is stored. The most important thing to understand is that one record is created for each agent, each day, for cases at a given priority level. That data consists of the pertinent summary information for those cases.
- Fields
- Agent Interactions - a count of messages sent by an agent
- Customer Interactions - a count of messages received from a customer
- When the "agent" is the portal user, agent interactions is always zero, and customer interactions is the total number of messages received from customers.
- Satisfaction Rating -
- The total value of all satisfaction ratings (for a given agent, on a given day, at a given priority) for cases in which a survey-response was received.
- Customer Satisfaction Case Record Count -
- The number of cases that have a customer_satisfaction rating for that day.
- (Divide the Satisfaction Rating by this value to calculate an average for the day.)
- Time to Resolve - The total time for all cases resolved that day, in that category.
- Divide that value by Resolved Cases (a count) to get an average.
- Considerations
-
- Cases of type "Problem" and "Incident" are recorded. Other case types are not recorded.
-
- Customers who create cases directly are known collectively as the "Portal User" agent. That value can be used to filter out customer data from a report.
-
- You can filter data by agent, by date range, and by priority.
-
- Response and resolution times are stored in minutes. (The business calendar is not taken into account.)
- To convert a time to hours:
- Create or customize a Report.
- In the Fields tab, at the bottom of the page. click New Formula.
- Divide the time-field value by 60 to get a value in hours.
For example: time_to_closed / 60
-
- To convert a time to days, divide again by 24.
