Case Analytics
From AgileApps Support Wiki
Revision as of 20:15, 30 January 2014 by imported>Aeric (→Case Analytics Dashboard)
Case Analytics is a special feature of the ServiceDesk application. It consists of the Case Analytics dashboard, and the Case Analytics object. This article explains what you can do with them, and how they work.
Case Analytics Dashboard
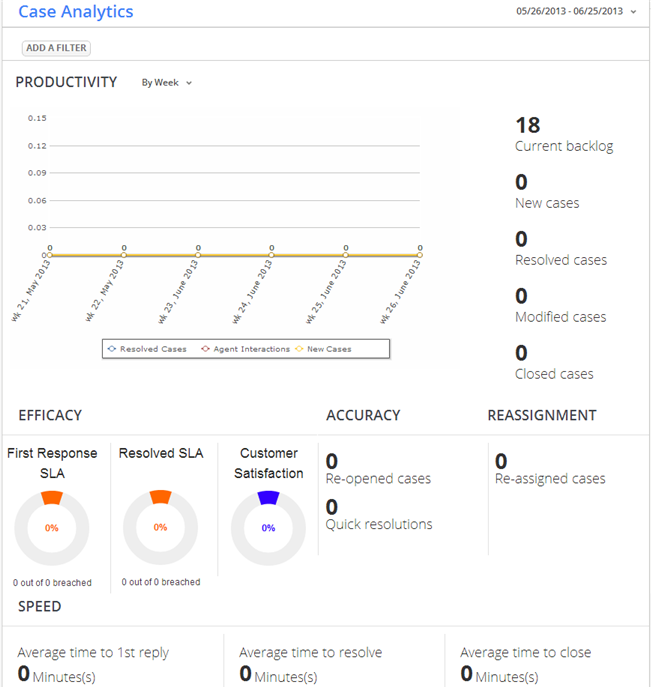
The image below shows the initial dashboard displayed in the ServiceDesk application. In the table, aggregate number of cases is shown for each agent, each day, for each of the priority levels.
To modify the display:
- Click [Add a Filter]
- Choose the agent, priority, and date range to display.
The graph changes to show the selected data.
Case Analytics Object
- § Aggregate values for each agent, each day, for all cases at a given priority.
- (correspond to the dashboard filters)
- § Customers are identified as agent="Portal User". (Right now, the value is "portal".)
- Use that value to filter out customer data from a report
- § Satisfaction Rating = aggregate
- § Filter by agent &/or date range &/or priority in a report
- --stores data for each agent, for a given date
- --times stored in minutes (the business calendar is not taken into account)
- --show code to convert to hours and days
- --only types=problem or incident are recorded
- --customer_satisfaction_case_record_count is the number of cases that have a customer_satisfaction rating. Use it to calculate average for the day.
- --Time to Resolve is total time for all cases resolved
- Divide by Resolved Cases to get an average
- --Agent Interactions (msgs from an agent) & Customer Interactions (msgs from a customer)
- --when the "agent" is "portal user", agent interactions is always zero,
- and customer_interactions is the total number of messages sent by customers
